Fig. 2.
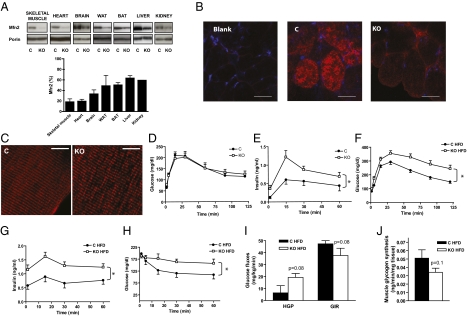
Mfn2 KO mice show impaired glucose tolerance, high plasma insulin levels, and insulin resistance in response to aging or HFD. (A) Mfn2 protein levels in mitochondrial extracts from several tissues in control (C) and Mfn2 KO mice and densitometric quantification (n = 3–8). (B) Confocal images of intracellular localization of Mfn2 by immunofluorescence in transversal sections of gastrocnemius muscles of control and KO mice. (Scale bars: 50 μm.) (C) Mitochondrial network was visualized by confocal microscopy using longitudinal sections of tibialis anterior muscles expressing a DsRed2-Mito vector that specifically labels mitochondria. (Scale bars: 50 μm.) (D) GTT on 54-wk-old mice (n = 8). (E) Insulin levels during the GTT in 54-wk-old mice (n = 8). (F) GTT on mice subjected to a HFD for 14 wk (n = 8–12). (G) Insulin levels during the GTT in HFD-fed mice (n = 8–12). (H) Insulin tolerance test in mice subjected to a HFD for 14 wk (n = 8–12). (I) Glucose fluxes during the euglycemic-hyperinsulinemic clamp in HFD-fed mice (26 wk) (n = 5). (J) Muscle glycogen synthesis assessed during euglycemic-hyperinsulinemic clamp in mice fed a HFD (n = 5). Data represent mean ± SEM. *P < 0.05 vs. control mice.

