Fig. 4.
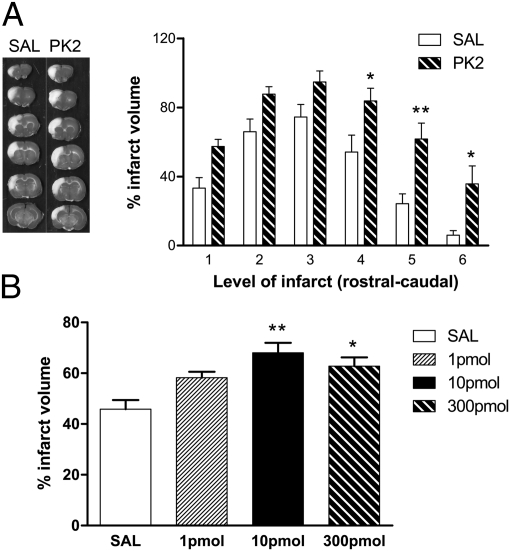
ICV PK2 worsened ischemic injury. (A) (Left) Representative images of TTC-stained brain treated with ICV saline (SAL) or PK2. White area indicates infarct tissue. (Right) Quantitation of infarct volume in brains treated with 300 pmol saline or PK2 (from rostral to caudal). ICV PK2 increased infarct volume significantly. n = 6 per group. *P < 0.05, **P < 0.01. Two-way ANOVA with Bonferroni's post hoc test indicates a significant difference between levels 4, 5, and 6. (B) Quantitation of infarct volume in brains treated with 1, 10, or 300 pmol saline (open bar) or PK2 (black and hatched bars). Treatment with 10 pmol PK2 had the most severe effect on infarct volume. Error bars represent SEM. n = 6–7 per group. *P < 0.05, **P < 0.01, one-way ANOVA with Bonferroni's post hoc test.

