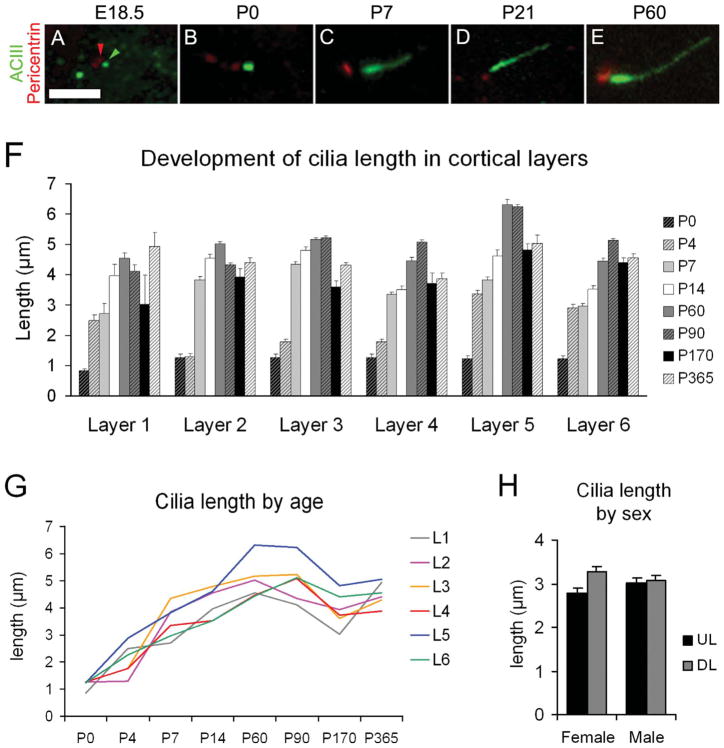
Figure 4.
Elongation of neuronal cilia over several postnatal weeks. A–E: Examples of basal bodies (pericentrin+; red; example indicated by red arrowhead) and cilia (ACIII+; green; example indicated by green arrowhead) for the indicated ages. F: Bar graph shows the average ± SEM of cilia length (μm) in the neocortical layers at the indicated ages. Because it was difficult to differentiate neocortical lamina at early ages, average lengths for layers 2–4 and layers 5–6 were pooled for P0, whereas at P4 layers 3 and 4 were also pooled. G: Graphic representation of cilia elongation across age in the cortical layers. Mean values of length are used (SEM values are omitted for clarity but can be found in Table 2). H: Comparison of cilia length in upper layers (2–4; UL) and deep layers (5–6; DL) of the neocortex in male and female P14 mice did not show significant effect of gender. Scale bar = 2.5 μm.

