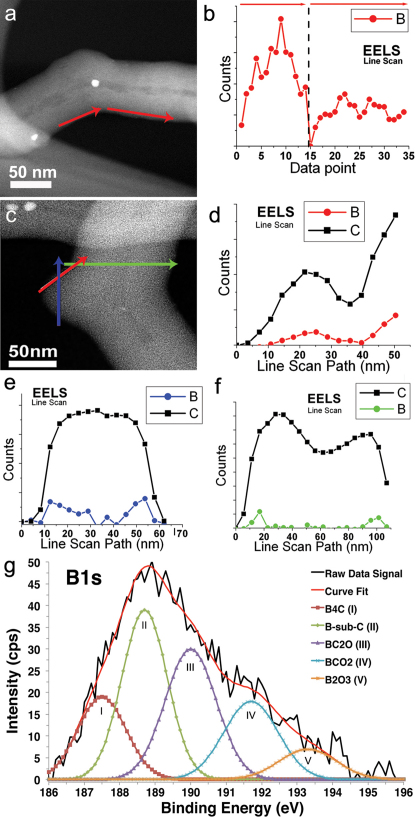
Figure 3. EELS boron mapping in regions of high curvature and XPS characterization of boron bonding state.
High angle annular dark field (HAADF) images of the CBxMWNT elbow defects and their corresponding EELS line scans; (a) linescan path (red arrows) along the negative curvature of elbow defect profiles for elemental boron counts; (b) along the path marked by the corresponding red arrows. The highest density of boron was found at the onset of the negative curvature; (c) HAADF image shows linescans performed on different locations (red, blue, and green arrows) mapping both elemental B (red, blue, and green) and C (black boxes) profiles; (d)–(f) seem to follow the same trend as further evidence of boron incorporation into the lattice; (f) Line scan across tube diameter (green arrow) where boron seems to be more easily detected at the outer layers near the regions of high negative curvature. The scale bar in (a) and (c) is 50 nm; (g) XPS characterizing boron bonding states and content. Five deconvoluted B1s bonding states are revealed, after argon ion-etch, at peak positions 187.6, 188.8, 190.1, 191.8, and 193.4 eV corresponding to the B–C bonding in B4C (187.8 eV), B-substituted-C within the hexagonal lattice (188.8 eV), BC2O (190.0 eV), BCO2 (192.0 eV), and B2O3 (193.2 eV). The majority bonding state is B-substituted-C and BC2O on the CBXMWNT surface, and the boron content is ca. 0.7 at%.

