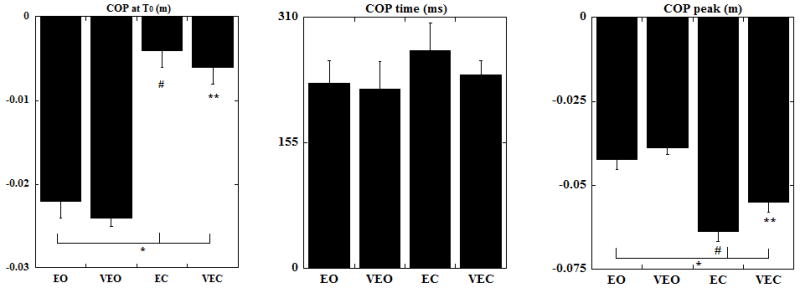
Fig. 5.

The magnitude of COP displacement at T0, the time of the COP peak and the magnitude of peak COP displacement are shown as mean with standard errors. COP positive values correspond to displacements in the direction opposite to the perturbation. * indicates statistical significance between EO-EC and EO-VEC, # indicates statistical significance between EC-VEO and ** indicates statistical significance between VEO-VEC conditions.
