
Figure 4. Application of MINE to Global Indicators from the World Health Organization.
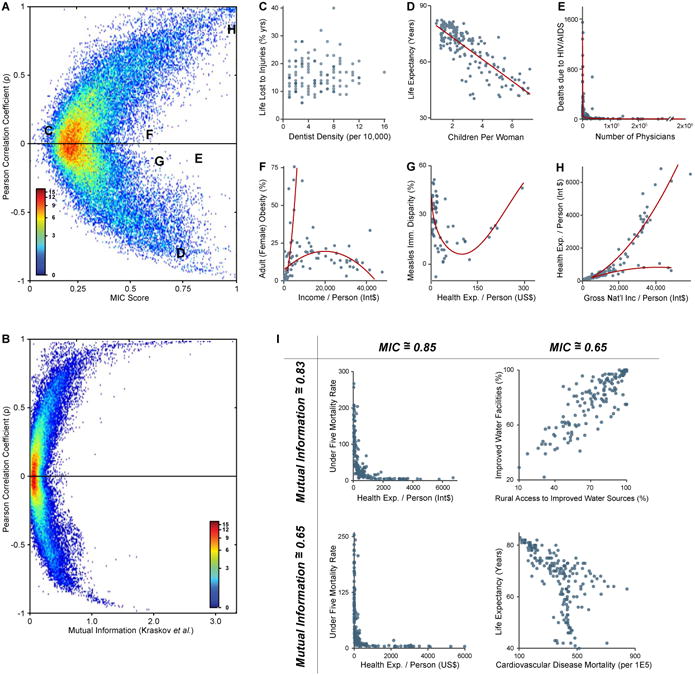
(A) MIC versus ρ for all pairwise relationships in the WHO dataset. (B) Mutual information (Kraskov et al. estimator) versus ρ for the same relationships. High mutual information scores tend to be assigned only to relationships with high ρ, while MIC gives high scores also to relationships that are non-linear. (C-H) Example relationships from (A). (C) Both ρ and MIC yield low scores for uncorrelated variables. (D) Ordinary linear relationships score high under both tests. (E-G) Relationships detected by MIC but not by ρ, because the relationships are non-linear (E,G) or because more than one relationship is present (F). In (F), the linear trendline comprises a set of Pacific island nations in which obesity is culturally valued (33); most other countries follow a parabolic trend (Table S10). (H) A superposition of two relationships that scores high under all three tests, presumably because the majority of points obey one relationship. The less steep minority trend consists of thirteen countries whose economies rely largely on oil (37) (Table S11). The lines of best fit in (D-H) were generated using polynomial regression on each trend. (I) Of these four relationships, the left two appear less noisy than the right two. MIC accordingly assigns higher scores to the two relationships on the left. In contrast, mutual information assigns similar scores to the top two relationships and similar scores to the bottom two relationships.