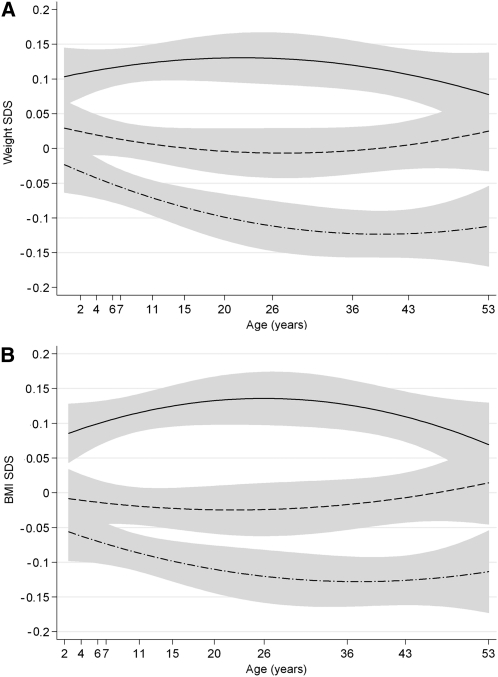
FIGURE 2.
Predicted weight and BMI by tertiles of the obesity-risk-allele score. From prediction models of weight (A) and BMI (B) SDS by risk-allele-score tertiles with fitted quadratic age interaction terms. The solid line represents the mean SDS in those in the highest tertile of the risk-allele score, the dashed line the middle tertile, and the dash-dot line the lowest tertile. Shaded areas indicate 95% CIs. SDS, SD scores.

