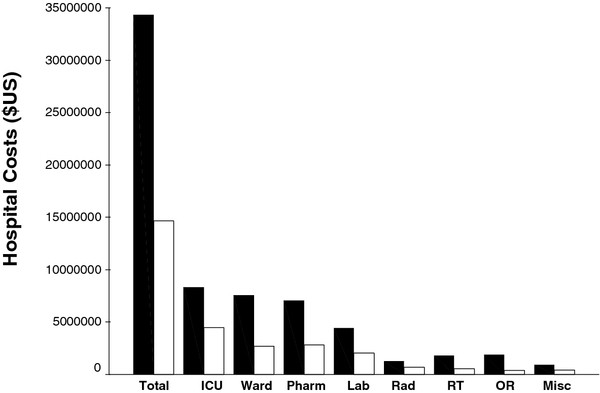
Figure 2.

Bar graph depicting total hospital costs and individual cost centers costs. Black bars represent patients with prior antibiotic exposure and white bars represent patients without prior antibiotic exposure. ICU = intensive care unit, Pharm = pharmacy, Lab = laboratory, RT = respiratory therapy, OR = operating room, RAD = radiology, Misc = miscellaneous.
