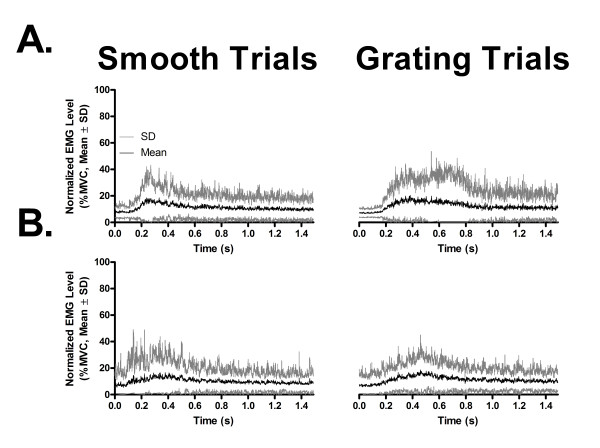
Figure 1.
EMG activity during grating and smooth trials in young and older adults. Muscle activation pattern elicited in the right FDI in Experiment I during task execution in young (A) and older (B) adults. The traces represent the overall mean (± SD) of all participants' rectified electromyographic (EMG) activity level in each age group (n = 16) recorded prior to application of TMS pulse over the left primary motor cortex, normalized as a percentage of each participant's MVC, for all grating (n = 12) and smooth (n = 12) trials. Note the close similarity in the pattern of muscular activation between the two types of trials, and in both age groups.

