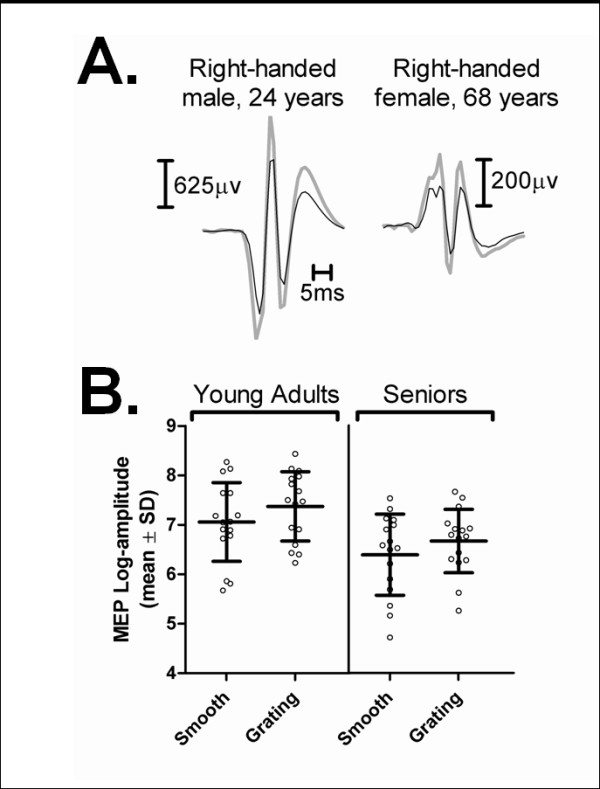
Figure 2.

MEP amplitudes during the smooth vs. grating trials in Experiment I. A. Examples of task-related differential modulation in MEP amplitude under the two trial types in a typical young (right-handed male, aged 23 years) and a typical older (right-handed female, aged 68 years) participant. Each trace is an average of 12 responses. B. Comparison of mean MEP log-amplitudes in the two trial types (grating/smooth). Each bar represents the mean of individual values computed under each trial type for all young adult (N = 16) and senior participants (N = 16). Note that extra facilitation was observed during the grating trials compared to the smooth trials, and the main effect of trial type was significant for the overall variations in MEP log-amplitude (F1,30 = 12.72, p = 0.001, partial eta squared = 0.30).
