Figure 4.

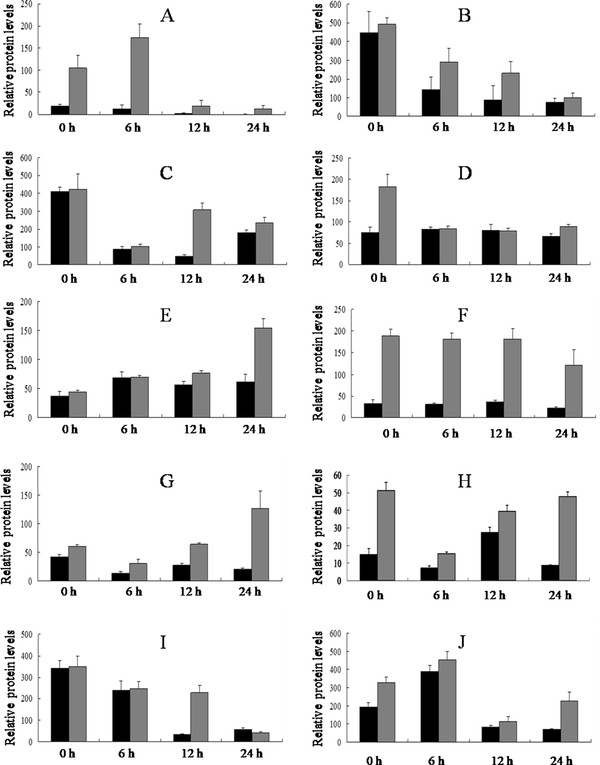
The volume changes of 10 differentially expressed spots. Control (black) and treated (gray). A - Jrepresent spot 1 - 10 respectively. Error bars represent the SD. The scales are different for the different proteins.

The volume changes of 10 differentially expressed spots. Control (black) and treated (gray). A - Jrepresent spot 1 - 10 respectively. Error bars represent the SD. The scales are different for the different proteins.