
Figure 2. Kinase inhibition selectivity of C1.
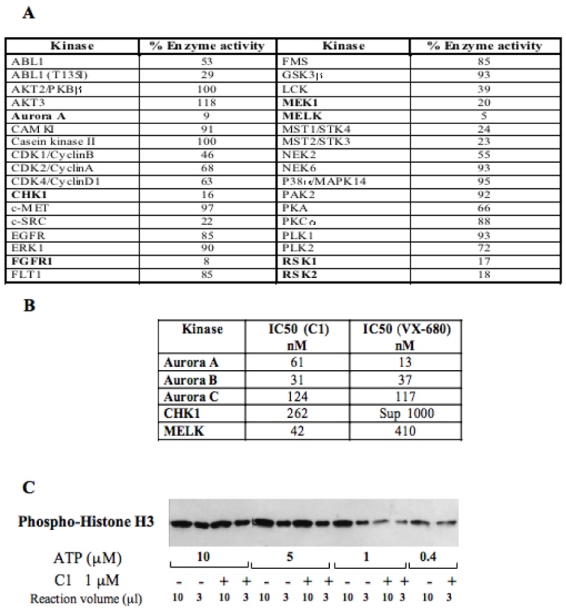
(A) C1 kinase profiling. 36 recombinant kinases were used in the study. The percentage of the remaining kinase activity measured upon treatment with 1 μM C1 in a solution containing 1 μM ATP is presented. Kinases, inhibited by more than 80 %, are indicated in bold.
(B) IC50 values for the five best kinase targets of C1. For comparison the IC50 for VX-680 for the same kinases is also shown. The measurements of IC50 for both compounds were carried out under identical conditions.
(C) Western blot analysis of the effect of C1 on the phosphorylation of histone H3 by Aurora A domain kinase. A kinase assay was carried out either in absence (−) or in the presence (+) of C1 (1μM) and at decreasing concentrations of ATP. Each reaction contained the same amount of histone H3. After completion of the reaction, 10 and 3 μl of the reaction mixtures containing either 10, or 5 or 1μM ATP were run on an SDS gel (for the reaction carried out in the presence of 0.4 μM ATP, an aliquot of only 10 μl was run). After blotting, the phosphorylation of histone H3 was revealed by a specific antibody against the phosphorylated histone H3.