
Figure 6. Effects of C1 on cell viability in two-dimensional and three-dimensional culture conditions; Effect on mice bearing H358 tumours.
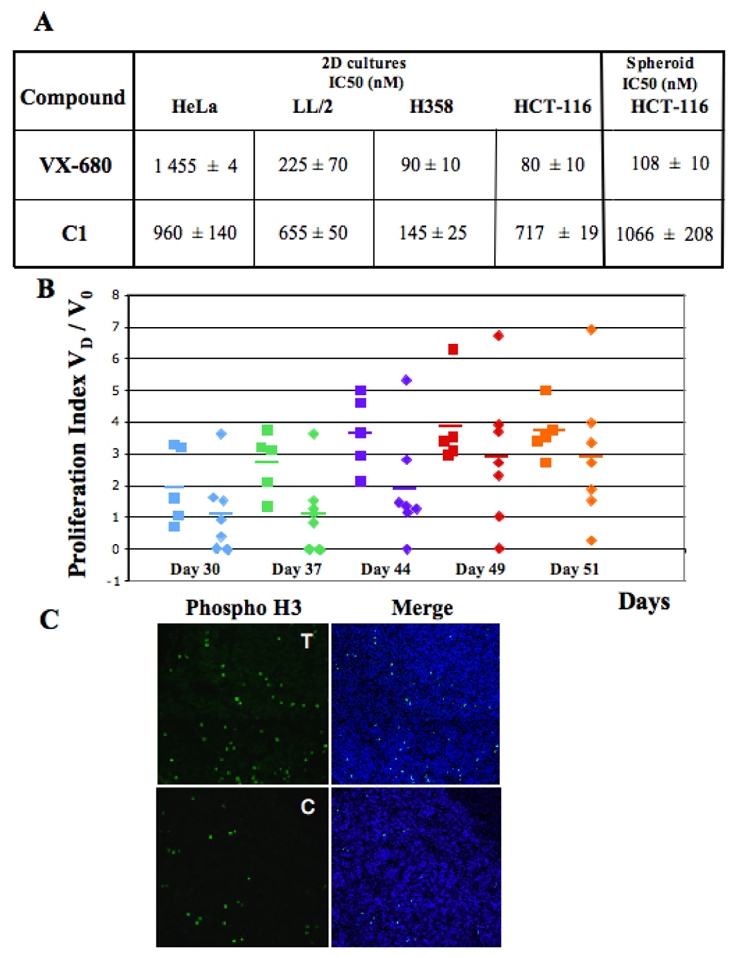
(A) C1 and VX-680 IC50 for HeLa, LL/2, H358 and HCT-116 cells in culture (two-dimensional conditions) and for HCT-116 spheroids (3D conditions). Cell growth and viability were tested under standard conditions in 96 well culture plates with MTT (Promega) cell assay. The average of three independent experiments is shown. Note that similar IC50 were determined for C1 and VX-680 towards H358 cells.
(B) Proliferation indexes of H358 tumor growth. Mice were injected with 2 ×10⁶ cells. Tumor dimensions were measured at days 7, 8, 30, 37, 44, 49 post-injection and the 20 proliferation index (the ratio Vd/V0, where Vd is the volume of the tumour at the respective day, and V0 is the average volume of the tumour calculated at day 7 and 8). Square: control mice; diamond: treated mice. The data for day 30 (D30) post-injection are in blue, D37 data are in green, D44 data are in violet, D49 data are in red and D51 in orange. Each point presents the proliferation index of one mouse tumour and the horizontal bars represent the average index of the series.
(C) Histone H3 phosphorylation is decreased in C1 treated tumours. At day 51 post-injection the control and the C1 treated H358 tumour bearing cell mice were sacrificed and a small part of the tumours were immediately frozen. The phosphorylation status of histone H3 in frozen sections of the tumours of the control (C) or C1 treated mice (T) was visualized by using a specific anti-phosphorylated histone H3 antibody (in green). DNA (blue) was stained by Hoechst 33342. Merge (DNA plus phospo – histone H3) is shown.