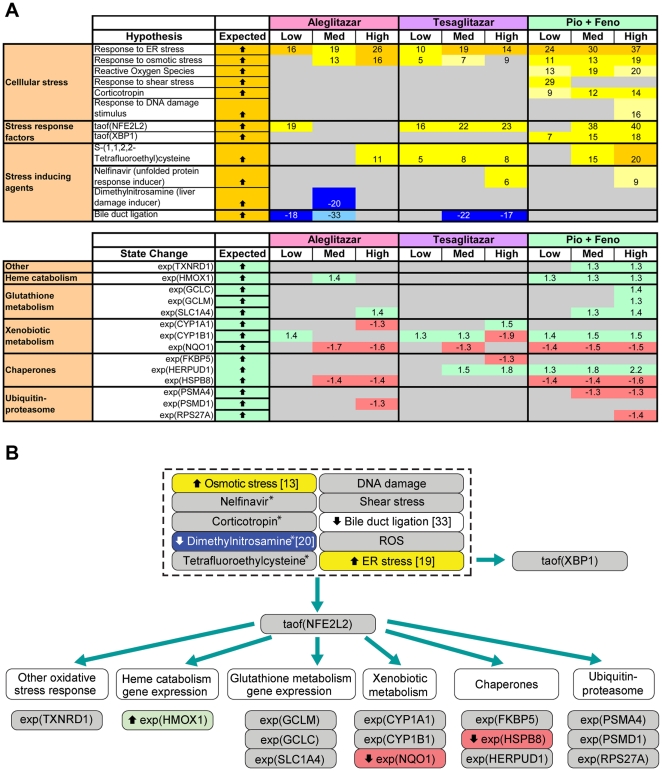
Figure 6. Cellular stress response-associated RNA changes and inferred signaling pathways.
(A) Biologic processes associated with the cellular stress response inferred to increase or decrease upon treatment with aleglitazar, tesaglitazar or Pio/Feno. See Figure 2A for treatment dosages. As in Figure 5A , proxy hypotheses are shown. (B) Molecular signaling pathway, predicted by RNA state changes shown in panel A, that could lead to changes in the stress response. Numbers in the blue or yellow boxes indicate the number of gene expression state changes that support the inference: negative numbers indicate an inferred decrease and positive numbers indicate an inferred increase. Numbers in the green or red boxes indicate the log fold change. * Denotes genes/pathways responsive to the agent cited. ER, endoplasmic reticulum; Med, medium; ROS, reactive oxygen species.

