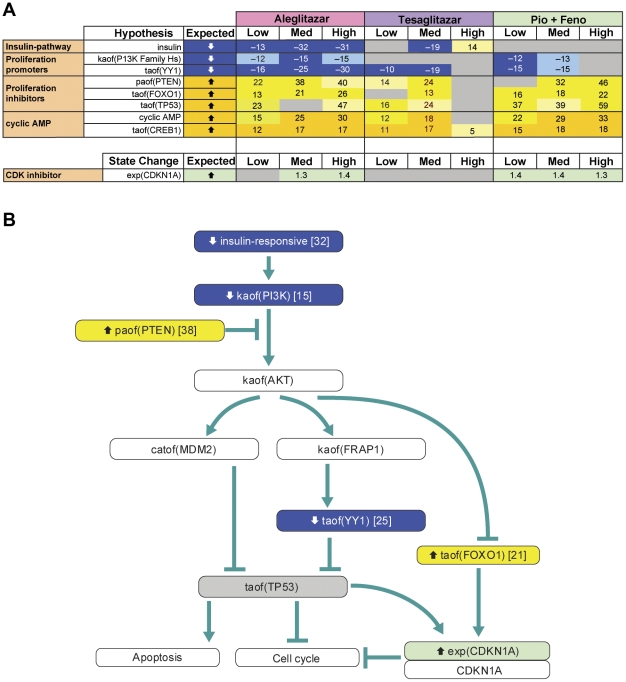
Figure 7. Insulin signaling and biologic response-associated RNA changes and inferred signaling pathways.
(A) Observed RNA state changes related to insulin signaling and biologic processes inferred to increase or decrease upon treatment with aleglitazar, tesaglitazar or Pio/Feno. See Figure 2A for treatment dosages. (B) Molecular signaling pathway that could lead to changes in insulin signaling to decrease cellular proliferation. Depiction is based on data derived from treatment with the medium concentration of aleglitazar. Numbers in the blue or yellow boxes indicate the number of gene expression state changes that support the inference: negative numbers indicate an inferred decrease and positive numbers indicate an inferred increase. Numbers in the green or red boxes indicate the log fold change. AMP, adenosine monophosphate; CDK, cyclin-dependent kinase; Med, medium.

