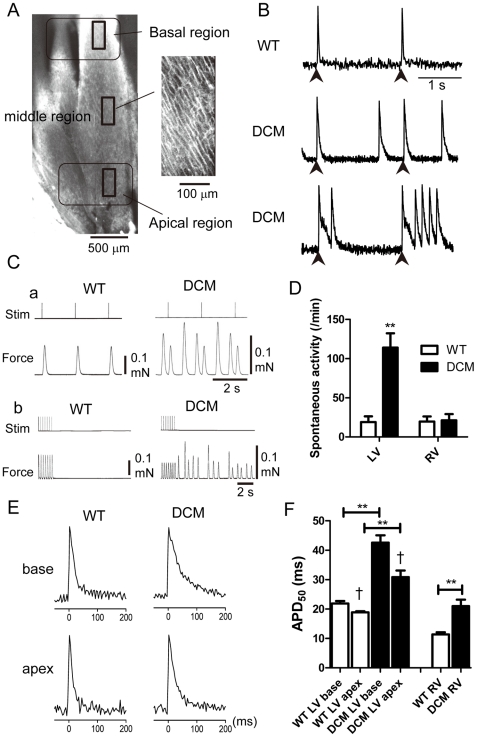
Figure 2. AP signals and force records obtained from WT and DCM LV at 2 months.
A. Typical images of the endocardial surface of live LV muscle from a WT mouse. Left: The LV muscle wall observed from the endocardial side using a 4× objective. Six images were combined to produce the full image. Right: Image of cardiac surface muscle cells (256×512 pixels, 160×320 µm area) observed with a 20× objective. Action potential signals shown in B and E were obtained from this size of area. B. Representative AP signals recorded from the LVs of WT (top) and DCM (middle and bottom) mice stimulated at 0.5 Hz. AP signals were obtained from middle region as 8×16 pixel images at 3.67 ms intervals. Arrowheads indicate field stimulation. Experiments were carried out at 25–27°C. C. Representative traces showing force development in LV papillary muscle from a WT (left) and DCM (right) mouse during 0.5 Hz field stimulation (a) and during and after 3 Hz field stimulation (b). D. Average frequency of spontaneous contractions after 3 Hz field stimulation in LV and RV. Means ± SEM. (WT, n = 10; DCM, n = 14). E. Representative AP signals from the basal and apical regions of endocardial surface (see Panel A) of a LV stimulated at 0.5 Hz. F. Comparison of APD50 values in the basal and apical regions of LVs and center region of RVs from WT (LV: base, n = 41; apex, n = 41 from 10 hearts, RV center region: n = 18 from 4 hearts,) and DCM (base, n = 85; apex, n = 64 from 14 hearts, RV: n = 35 from 7 hearts). Means ± SEM. **P<0.01 between WT and DCM. †P<0.05 between base and apex in LV.

