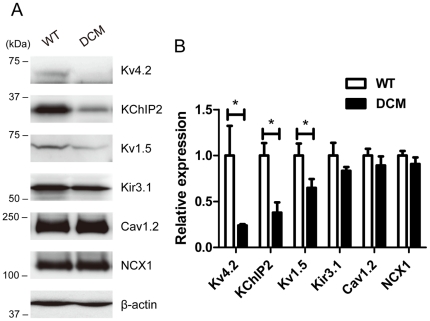
Figure 5. Western blot analysis of major channel proteins in LV.
The membrane protein samples (50 µg protein for each) from 2-month WT (n = 4) and DCM LVs (n = 5) were separated by SDS-PAGE and Western blot analysis was carried out. See Methods for detail. A. Representative immunoblots of individual experiments. B. Averaged expression levels. The relative expression levels for each protein were normalized to the average value for the WT. Data are means ± SEM (WT: n = 4, DCM: n = 5). **P<0.01 between WT and DCM.

