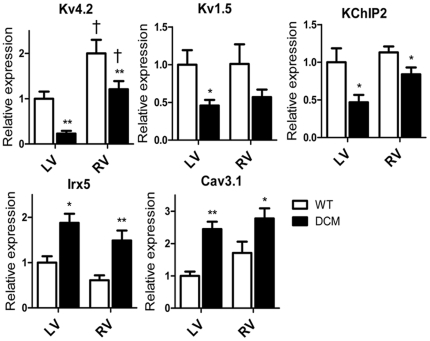
Figure 6. Comparison of mRNA expression between LV and RV.
The expression levels of each gene are expressed relative to the average of WT LV. Data from LV are the same as in Figure 4. (n = 7 for each). **P<0.01, *P<0.05 between WT and DCM. †P<0.05 between LV and RV.

