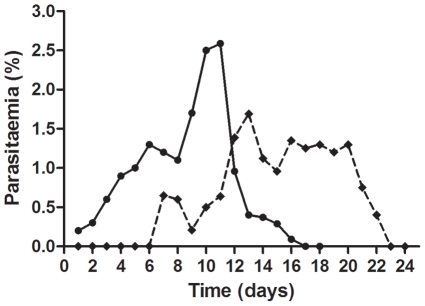
Figure 1. Kinetics of parasitaemia (asexual stages only, black dots) and gametocytaemia (stages 1–5; black squares) by microscopic observation, represented as a percentage of total erythrocytes.
The number of asexual forms increased up to maximum parasitaemia on day 11. From that time onwards, a rapid decrease occurred leading to a parasitaemia (asexual stages) close to zero on day 17. Sexual forms were first detected on day 7, and gametocytaemia reached a peak of 1.69% on day 13. The gametocytes, initially in early forms, developed into mature stages reaching stages IV and V from day 15 to 20. After day 15, more than 70% of the gametocytes are in stage IV–V.

