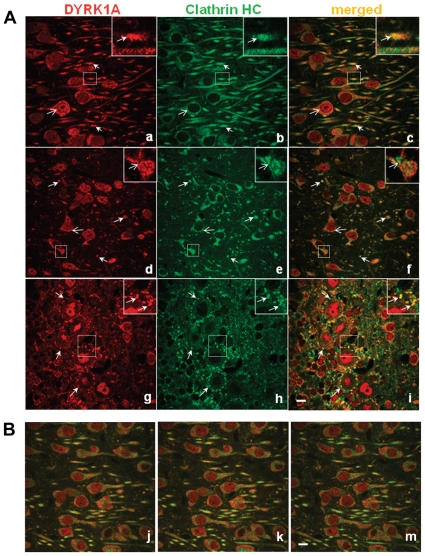
Figure 10. Co-localization of endogenous Dyrk1A and clathrin in the adult mouse brains.
Forty micrometer sections of the mouse brain tissues were incubated with polyclonal anti-Dyrk1A (red, a, d, and g) and monoclonal anti-CHC (green, b, e, and h) antibodies as described in MATERIALS AND METHODS . Presented are Z-stack images collected from the subiculum (a–c), the medio-posterior thalamic nucleus (d–f), and individual confocal images from the cerebellar Purkinje cell layer (g–i). Structures showing co-localization of Dyrk1A and CHC are visible on merged images (yellow in c, f, i). The dotted squares shown in a–i are enlarged in the upper right corners. Scale bar = 10 µm. Panels (j–m) show three consecutive scanning images from subiculum. Pearson's correlation coefficients for three consecutive scanning images from subiculum and the medio-posterior thalamic nucleus were calculated as 0.439 and 0.499, respectively, by using NIH Image J with the JACoP plug-in [65].

