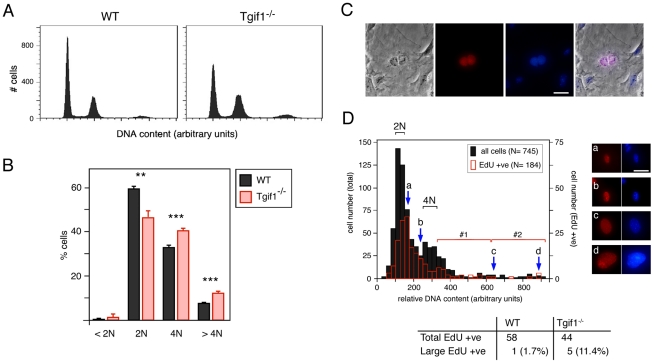
Figure 2. Cell cycle analysis of Tgif1 null MEFs.
A) Cell cycle profiles of wild type and Tgif1 null MEFs at passage 4 were generated by propidium iodide staining and FACS analysis. DNA content is plotted against cell number. B) Cell cycle distribution was determined as in panel A, and the percentage of cells with 2N or 4N DNA content, as well as those with greater than 4N and less than 2N is shown, as the average + s.d of triplicate cultures. P-values determined by the Student's T test are indicated: **<0.01, ***<0.001. C and D) Wild type and Tgif1 null MEFs were incubated with EdU (for 1 hour) and stained with Hoechst, and images were captured at 10× magnification in Openlab. A representative image of an EdU positive binucleate cell is shown (C): From left to right: Phase contrast image, EdU staining (red), Hoechst stain for DNA (blue), and an overlay of all three images. D) Relative DNA content, visualized by Hoechst stain, was determined in Openlab and is plotted against cell number (black bars, 745 cells in total). The open red bars indicate the number of EdU positive cells (of 184 total) with the indicated DNA content as determined by Hoechst staining. The approximate positions of 2N and 4N DNA content peaks are indicated. Arrows (a, b, c, d) indicate the position on the profile of the representative cells shown to the right. The region of the profile containing cells with greater than 4N DNA content was divided in half (brackets #1 and 2). EdU positive cells with DNA contents that fall into bracket 2 in the cell cycle profile were quantified as a percentage of the total EdU positive population for each genotype. Scale bars = 100 µM.

