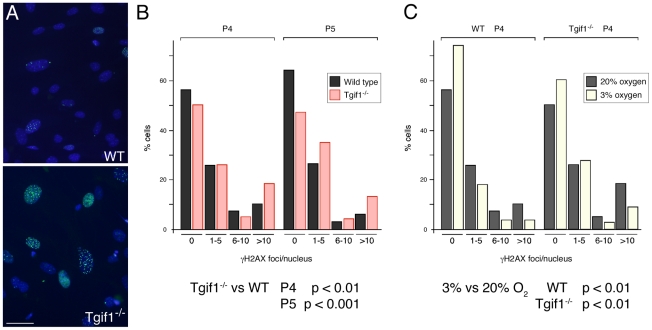
Figure 3. Tgif1 null MEFs have increased DNA damage foci.
A) Representative images of passage 5 cells stained with an antibody against γH2AX (green) and Hoechst (blue) are shown. Images were captured at 20×. Scale bar = 50 µM. B) The distribution of the number of γH2AX damage foci per nucleus is shown for passage 4 and 5 wild type and Tgif1 null cells. Significance values were determined by Chi squared test, comparing the distribution in Tgif1 null to that expected based on the wild type. C) The distributions of the number of γH2AX damage foci per nucleus in passage 4 cells were compared to those from cells that had been grown in 3% oxygen from passage 2 to 4. Data is presented and analyzed as in B. Note that the P4 MEFs analyzed for damage foci in 20% oxygen in panels B and C are the same. p-values for the comparisons of wild type to Tgif1 null and 3% to 20% oxygen are shown below.

