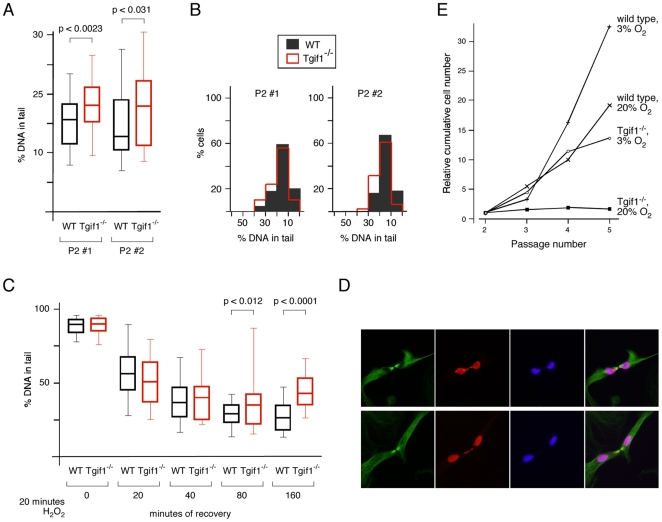
Figure 4. Increased DNA damage in MEFs lacking Tgif1.
Passage 2 wild type and Tgif1 null cells were analyzed by comet assay, under denaturing conditions. The percentage of total DNA in the tail was quantified for at least 50 cells per condition. A) The percentage of DNA in the tail is plotted for each of two independent batches of wild type and Tgif1 null MEFs. Data is plotted as median, 25th and 75th percentiles (box) and 5th and 95th percentiles (whiskers). p-values determined by the Student's T test are shown. B) The data shown in A, binned into 5% blocks, are plotted to show the distribution. C) Cells were treated with 100 µM H2O2 for 20 minutes and analyzed by comet assay at time-points thereafter over a 160 minute time-course. Data are presented as in A, with p-values for comparisons between wild type and Tgif1 null shown where significant. D) representative images of mitotic cells with DNA bridges are shown for Tgif1 null cells. Cells analyzed for α-tubulin (green), pHH3 (red), and Hoechst (blue) are shown, together with a merged image of all three colors. Images were captured at 40×. Scale bar = 25 µM. E) Wild type and Tgif1 null MEFs were grown on a 3T3 protocol in a standard incubator (5% CO2 in air [20% O2]), or in a chamber with 5% CO2 and 3% O2. Growth is plotted as relative cumulative cell number, with the starting 300,000 cells at P2 set equal to 1.

