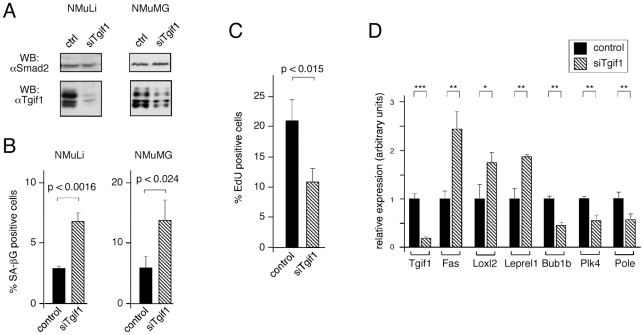
Figure 6. Proliferation defects with transient knock-down of Tgif1 in NMuLi cells.
A) NMuLi and NMuMG cells were transfected with siRNAs targeting Tgif1, or with a control pool, and Tgif1 protein levels were analyzed 48 hours later, by western blot. Smad2 levels are shown as a loading control. B) Control and Tgif1 knock-down NMuLi and NMuMG cells were analyzed for senescence associated β-gal staining 72 hours after knock-down. The percentage of SA β-gal positive cells is presented as mean + s.d. of triplicate transfections, together with p values. C) Control and Tgif1 knock-down NMuLi cells were analyzed for EdU incorporation, as a measure of proliferation. Cells were incubated with EdU for 1 hour, 48 hours after transfection. Data is presented as mean + s.d. of triplicate transfections, together with the p value. D) Expression of the ten genes analyzed in Figure 5D was tested in control and Tgif1 knock-down NMuLi cells by qRT-PCR from triplicate cultures. Data is shown for Tgif1 and the six genes for which differences in expression were significant. All p values were determined by the Student's T test (* p<0.05, ** p<0.01, *** p<0.001, for panel D).

