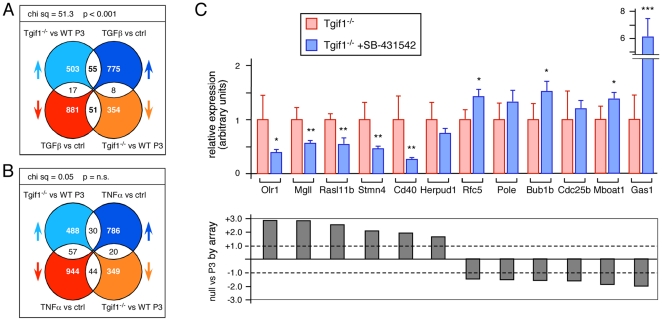
Figure 7. Overlap of TGFβ-mediated transcriptional changes with those in Tgif1 null MEFs.
A) Data from the comparison of Tgif1 null to wild type P3 MEFs was compared to that from MEFs treated with TGFβ for 10 hours (from GSE15871). Total numbers of probe-sets with significant changes, and the overlaps are shown as in Figure 5. Chi squared analysis was performed as in Figure 5 and is shown above. B) Data from the comparison of Tgif1 null to wild type P3 MEFs was compared to MEFs treated with TNFα for 4 hours (from GSE3700). Data was analyzed and is presented as in A. C) Twelve genes represented in the overlap shown in panel B were analyzed by qRT-PCR. Six genes each were selected from those that went up in both and those that went down in both. Expression was analyzed in triplicate cultures of passage 3 Tgif1 null MEFs treated with a TGFβ receptor kinase inhibitor (1 µM SB-431542), or left untreated. Data is shown as mean (+ s.d.) with the value in the untreated cells set to 1 in each case. * p<0.05, ** p<0.01, *** p<0.001, as determined by the Student's T test. Shown below is the fold change (on a linear scale) in the comparison of the Tgif1 null to wild type P3 array data for each gene.

