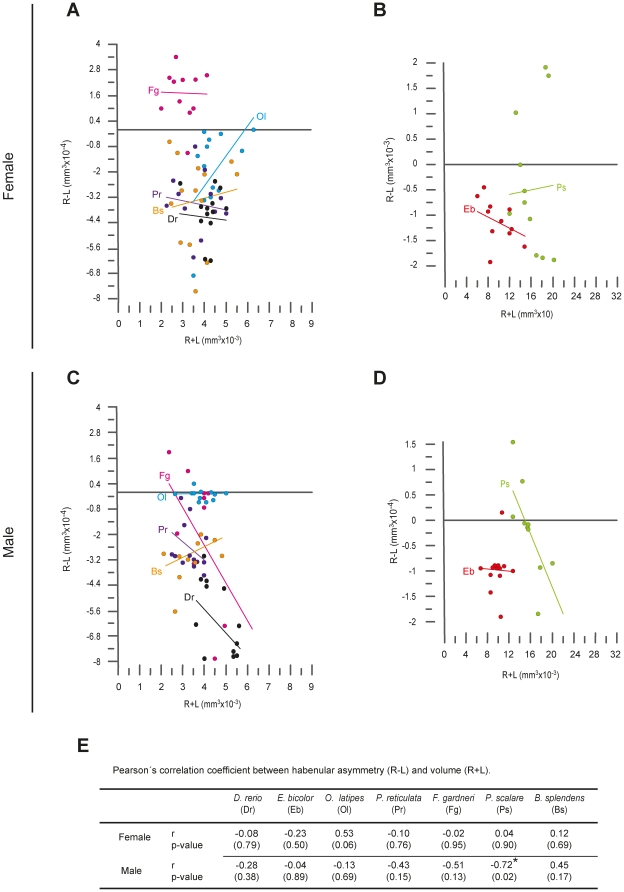
Figure 4. Relationship between habenular volume and laterality Index.
(A–D) Plots showing the relation between habenular volume (rHb+lHb, in mm3×10−3) and asymmetry (rHb - lHb, in mm3×10−4) in different species of teleosts. Data corresponding to different species have been presented in two rows, each representing sex (female = top; male = bottom), and grouped into two columns according to the size of individuals (left = smaller fish; right = larger fish). Groups of dots sharing the same colour correspond to individuals of a single species, and the line of equivalent colour depicts the linear regression of that group. The abbreviation for each species is given on either left or right sides of the regression line, according to the code given in E. (E) Pearson's correlation coefficient (r) and p values (in parenthesis) for each species and sex. The asterisk indicates the presence of statistically significant correlation between habenular volume and asymmetry (p<0.05).

