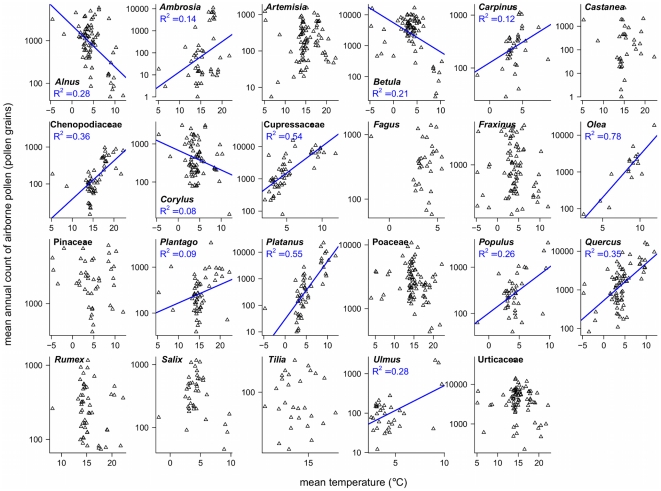
Figure 5. Mean API against mean local temperature.
Log-scaled mean annual sum of airborne pollen was plotted against local mean temperature for 23 pollen taxa. Mean temperatures were calculated for two periods, January to April (associated with the flowering of Alnus, Betula, Carpinus, Corylus, Cupressaceae, Fagus, Fraxinus, Olea, Pinaceae, Platanus, Populus, Quercus, Salix, and Ulmus) or April to August (related to Ambrosia, Artemisia, Castanea, Chenopodiaceae, Plantago, Poaceae, Rumex, Tilia, and Urtica), over the period 1977–2009. Only significant regression lines are shown.

