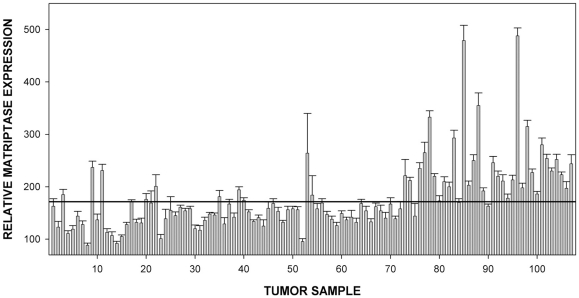
Figure 2. Analysis of matriptase protein levels in a panel of 107 primary tumor biopsies from Edinburgh Breast Cancer Unit.
The samples were spotted on the same slides as cell lines in Fig. 1 and the “cut off” line is placed at identical value as in Fig. 1A. Error bars represent standard deviations.

