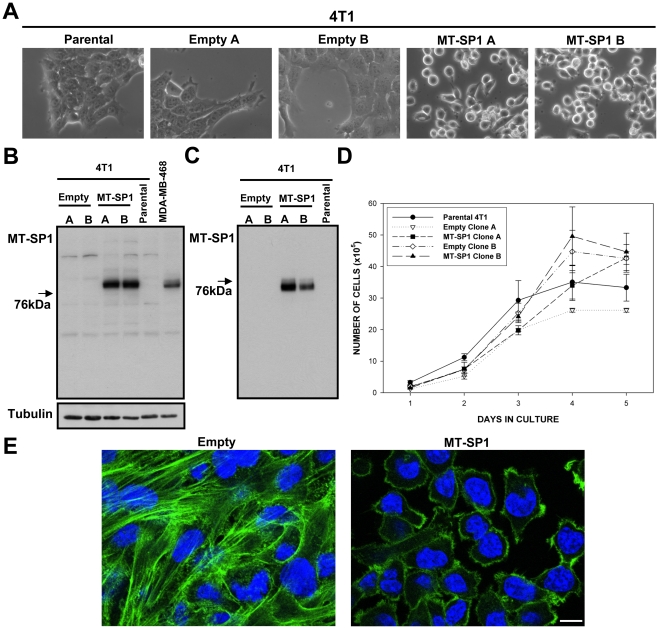
Figure 5. Properties of the 4T1 cells engineered to overexpress matriptase (MT-SP1 A, MT-SP1 B) and the respective control clones (Empty A, Empty B).
(A) Bright field images of the selected clones and parental cells. (B) Western blots performed on total cell lysates, and (C) proteins precipitated from conditioned medium, using matriptase specific antibody. (D) In vitro growth curves for the selected clones and the parental cell line. Although some “between-clone” variations were found (p<0.05) they were not associated with the presence or absence of MT-SP1 overexpression. (E) Representative fluorescence images of MT-SP1 B and Empty B cells stained with fluorescein-labelled phalloidin (actin cytoskeleton) and DAPI (nuclei). Similar results were obtained with MT-SP1 A and Empty A clones respectively. Scale bar 10 µm.

