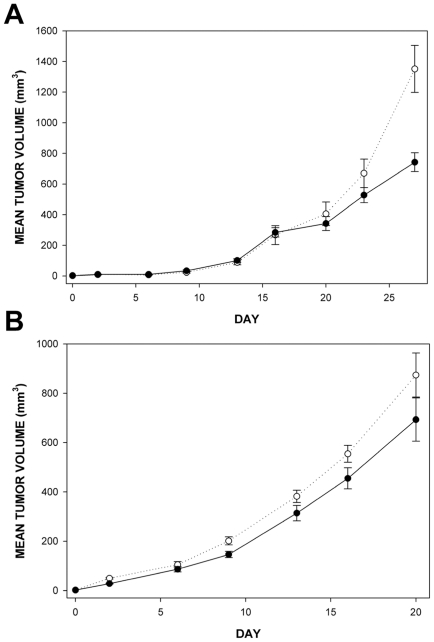
Figure 7. In vivo growth characteristics of indicated MDA-MB-231 and 4T1 cells engineered to stably overexpress matriptase (MT-SP1) and the respective control.
clones. The cells were injected into mammary fat pads of CD1 nude mice and grown as described in the materials and methods section. There were at least five animals in each group. (A) Growth curves of MDA-MB-231 MT-SP1 B (black circles) and MDA-MB-231 Empty A (white circles) clones. The MT-SP1 overexpressing cells grew significantly slower than the empty vector control cells (p = 0.003 on day 27). (B) Growth curves for 4T1 MT-SP1 B (black circles) and 4T1 Empty B (white circles) clones. The MT-SP1 overexpressing cells grew slower than the empty vector control cells although this was not statistically significant (p = 0.107 on day 16 and p = 0.187 on day 20). Error bars represent standard errors.

