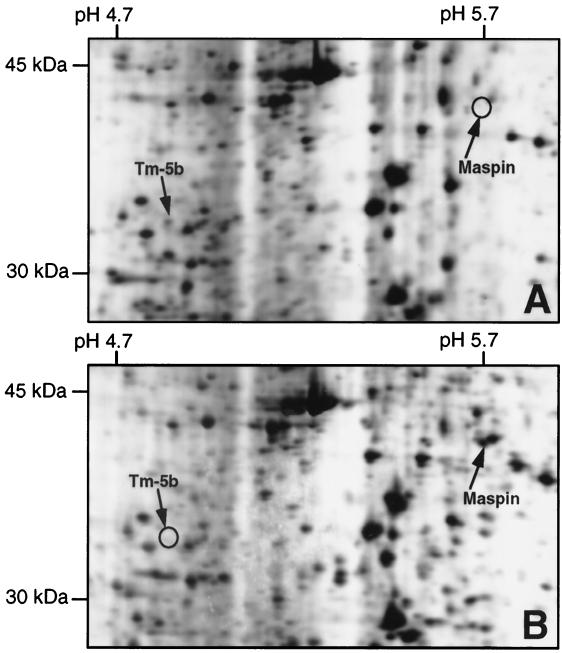
Figure 1.
Silver-stained details of 2D gel electrophoresis polypeptide maps of DMSO-induced LA7 cells (A) and uninduced 106A10 cells (B). Spots were named by protein identification by mass spectrometry analysis. Differential expression of Tm-5b and maspin proteins is indicated with ○ in B and A, respectively.

