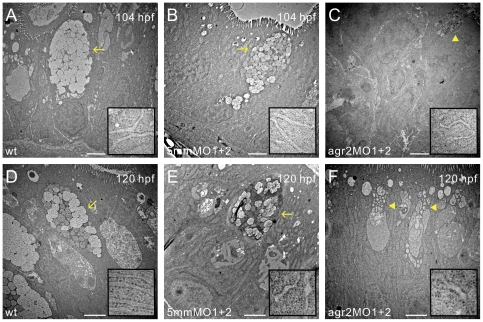
Figure 4. Transmission electron microscopy shows abnormal goblet cell structures in agr2 morphants.
Mid-intestinal images of 104- and 120-hpf wild type (A, D), agr2–5 mmMO1 and 5 mmMO2-coinjected (B, E), and agr2 morphants (C, F) are shown. ER ultrastructure at higher magnification is shown in insets. Arrows indicate mature goblet cells and arrowheads denote immature goblet cells. Scale bars represent 2 µm.

