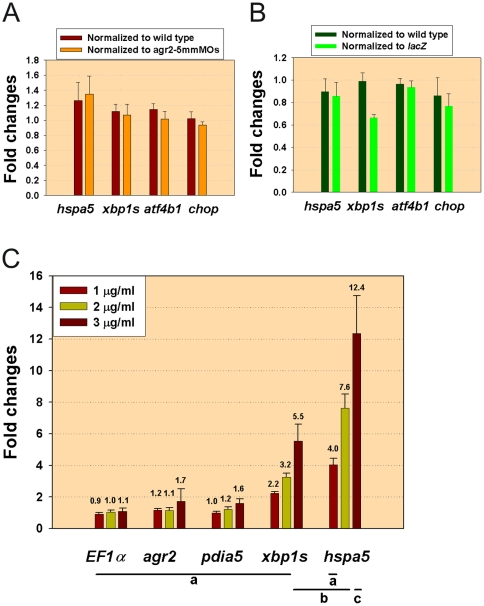
Figure 6. agr2 expression is not induced by tunicamycin treatment and perturbation of agr2 level does not induce ER stress.
(A) Expression level of members of the UPR pathway (hspa5, xbp1s, atf4b1, chop) was not altered in agr2 morphants when normalized to wild type or to agr2–5 mmMO1 and 5 mmMO2-coinjected 104-hpf embryos by qPCR. (B) Expression of members of the UPR pathway (hspa5, xbp1s, atf4b1, chop) was not altered in agr2-overexpressed 104-hpf embryos when normalized to wild type or to lacZ-overexpressed embryos by qPCR. (C) agr2 expression level was not significantly induced upon 3 µg/ml tunicamycin treatment by qPCR. One-way analysis of variance and Tukey's honestly significant different method (T-method) were conducted among different genes after treatment with different concentrations of tunicamycin [27]. Different letters (a, b, c) indicate a statistically significant difference (p<0.05). Average gene expression in fold changes for respective gene is indicated. Error bars indicate the standard error.

