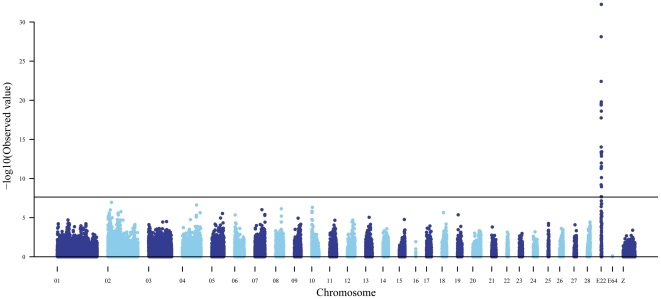
Figure 2. Manhattan plot of genome-wide association analysis for the Crest phenotype in chicken.
The x-axis shows the physical position of the SNPs by chromosome, and the y-axis shows -log10(p-values). A cutoff value of 7.63 declares a genome-wide highly significant association (P<0.001) with a Bonferroni correction. The microsatellite marker HOXC8–ssr that had the most significant p-value is located on LGE22C19W28 by HOXC8.

