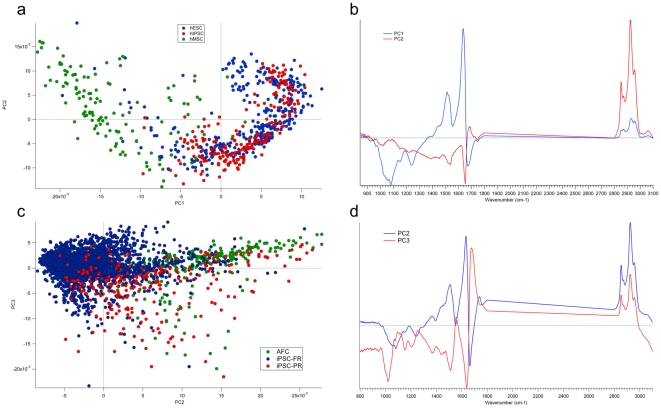
Figure 2. Identification of spectral signatures appearing during reprogrammation.
(A) Comparison of spectral signature of MSC-H9 with IPSC-H9 and parental H9. Scoreplot of the PLS-DA show a distinct and separated spectra of MSC-H9 (green), iPSC-H9 (red) and H9 (blue). H9 and iPSC-H9 clustered together with a similar spectra. (B) Loading plot corresponding to the comparison of spectral signature of MSC-H9 with IPSC-H9 and parental H9. PC1 and PC2 show that the difference between MSC-H9 and ESC-H9/iPSC-H9 spectra lies in the lipid∶protein and in the protein∶nucleic acid contents. (C) Comparison of spectral signatures between Partially Reprogrammed (PR) and Fully Reprogrammed (FR) iPSC and AFC. Scoreplot of the PCA of PC2 versus PC3 (representing respectively 20 and 8% of the spectral variance) using the 800–1800 and 2800–3100 cm−1 ranges show a separation between iPSC-PR (PB08-PR, PB14, PB15, PB18) and iPSC-FR (PB03, PB04, PB08-FR, PB10, PB13) with a change in lipid and glycogen storage in the PR iPS. (D) Loading plot of the comparison of spectral signatures between Partially Reprogrammed (PR) and Fully Reprogrammed (FR) iPSC and AFC. PC2 and PC3 illustrate the chemical variability in protein, glycogen, lipid and nucleic acid contents between AFC and iPSC at different stages of the reprogrammation process.

