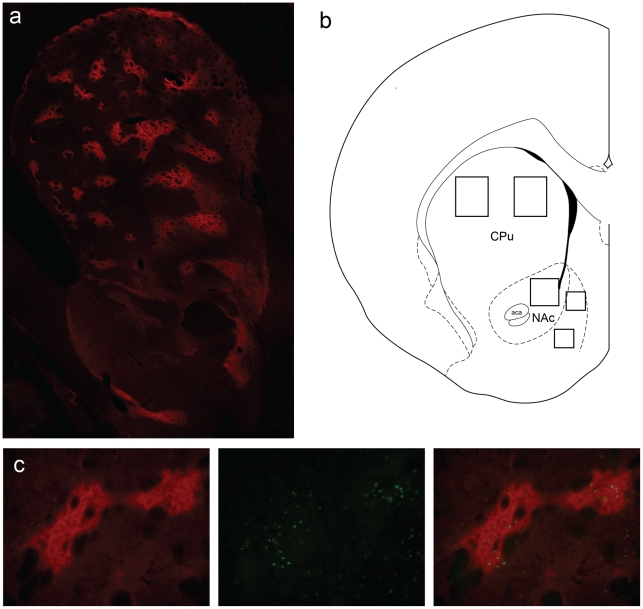
Figure 2. Images of MOR and Fos immunostained tissue.
(a) Image of MOR immunoreactivity in the striatum. (b) Placement of templates used for analysis of Fos expression in the dorsal caudate-putamen and nucleus accumbens core and shell. (c) Left, closeup image of MOR immunostained tissue displaying the patch and matrix compartments. Middle, closeup image of Fos expression. Right, overlay of the left and middle images demonstrating Fos expression in patch compartments.

