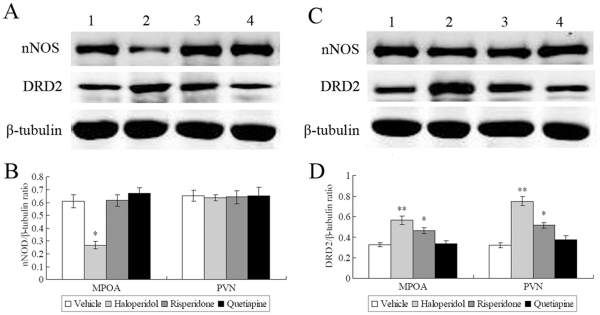
Figure 4. Representative western blot images of nNOS and DRD2 protein expression in the MPOA (A) and the PVN (C) following three weeks of antipsychotic drug administration.
The calculated ODs of nNOS (B) and DRD2 (D) protein bands were normalized to each β-tubulin OD and expressed as a ratio. nNOS protien in the MPOA but not the PVN was significantly decreased by haloperidol. Haloperidol and risperidone increased DRD2 protien expression in both the MPOA and the PVN. Lanes: 1 = Vehicle; 2 = haloperidol; 3 = risperdone; 4 = quetiapine. Data are means ± s.e.means and expressed in arbitrary units. *p<0.05 vs Vehicle; **p<0.001 vs Vehicle.

