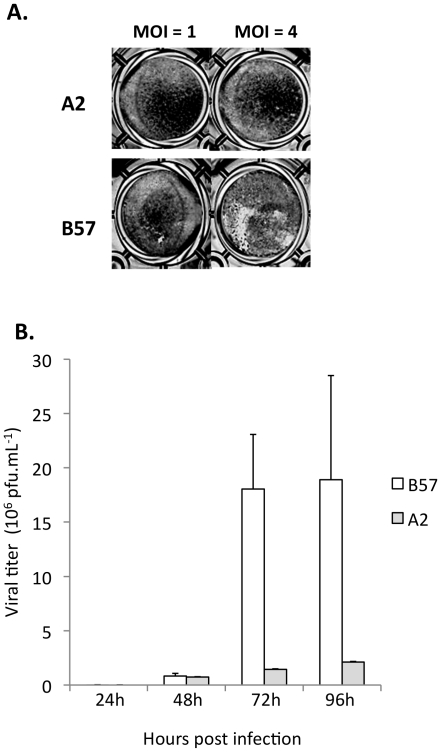
Figure 4. Different resistant phenotypes of cell lines A2 and B57.
(A): viral production in cells infected by VHSV at MOI 4. Two independent infections were performed. Viral titer was estimated by plaque assay on EPC cells in duplicates. (B): CPE after VHSV infection at MOI 1 and MOI 4. Cells were fixed 3 days post infection and colored with crystal violet.

