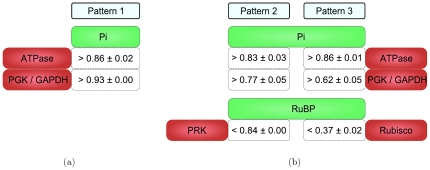
Figure 7. Example patterns with a) two or b) three stability conditions each.
For each enzyme-metabolite pair, a threshold for the saturation  is given. Enzymes are marked in red, their reactants are marked in green. Pattern 1 exhibited an average Laplace ratio of
  (
( ,
,  ). Pattern 2 affected less training samples because of its less strict threshold on the parameter associated with PGK and GAPDH but also produced more training errors and a lower Laplace value (
 ,
,  ). Pattern 3 affected an even larger number of hits but nevertheless, it produced fewer training errors than pattern 2. As a consequence, it exhibited the highest Laplace value of all the depicted patterns (
 ,
,  ,
,  ).
).

