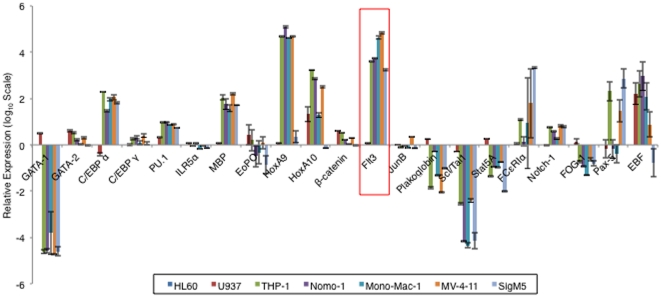
Figure 1. N-CoR loss is associated with the up-regulation of Flt3.
A, Relative expressions of selected hematopoietic genes in AML-M5 and non-AML-M5 (HL-60 and U937) cells were determined by real time PCR analysis. Data was analyzed via the comparative Ct method with the expression level of each gene in HL-60 cells set as the reference value, and the level of expression of the HPRT gene used as the endogenous control. The graph was plotted on a logarithmic scale with a base of 10. Expression levels in HL-60 cells for all genes were set to 0 while genes which were up-regulated relative to their expression levels in HL-60 cells was given a positive value, and those which were down-regulated relative to expression level in HL-60 cells were given a negative value. Raw Ct values that registered as undetermined were given a value of 40. (Results presented are the averages of 3 independent experiments.).

