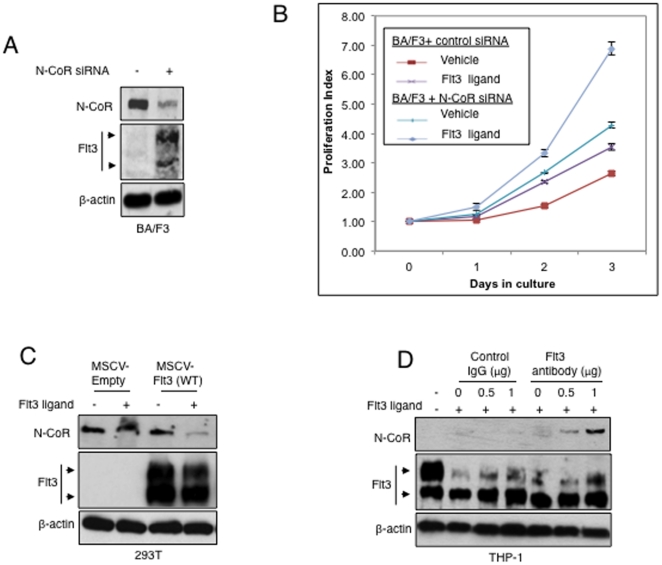
Figure 4. N-CoR loss promotes growth potential, which is amplified by Flt3 signaling activation.
A, Levels of N-CoR and Flt3 protein in Ba/F3 cells transfected with control or N-CoR siRNA were determined via western blotting assay with an anti-Flt3 antibody that recognizes the murine form of the receptor and anti-N-CoR antibody. B, N-CoR loss mediated Flt3 expression enhanced the IL-3 independent growth potential of BA/F3 cells. Effect of IL-3 independent growth of Ba/F3 cells transfected with control or N-CoR siRNA (population from 4A) with and without Flt3 ligand stimulation were determined by cell proliferation assay. The Y-axis of the graph represents the proliferation index of viable cells, and the duration of culture is plotted on the X-axis. The symbols used in the graph are as follows: Control siRNA transfected cells treated with vehicle (<$>\raster="rg1"<$>), Control siRNA transfected cells stimulated with Flt3 ligand (<$>\raster="rg2"<$>), N-CoR siRNA transfected cells treated with vehicle (<$>\raster="rg3"<$>) and N-CoR siRNA transfected cells stimulated with Flt3 ligand (<$>\raster="rg4"<$>). The values presented in each graph are average of three independent experiments. C, Flt3 stimulation leads to N-CoR loss. Levels of N-CoR and Flt3 proteins in 293T cells treated with vehicle or Flt3 ligand (30 ng/ml) was determined by western blotting assay. D, Blocking Flt3 stimulation leads to N-CoR stabilization in THP-1 cells. Effect of Flt3 antibody on the levels of N-CoR and Flt3 proteins in THP-1 cells treated with vehicle or Flt3 ligand (30 ng/ml) was determined by western blotting assay.

