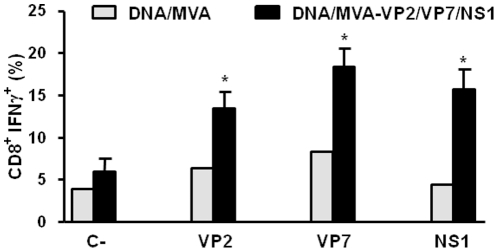
Figure 5. Intracellular staining of IFN-γ, in T CD8+ cells of DNA/rMVA-VP2/VP7/NS1 immunized IFNAR(−/−) mice.
Two weeks after second immunization spleens were harvested and the splenocytes were stimulated with 10 µg/ml of recombinant VP2, VP7 or NS1 proteins. At 72 h post-stimulation, intracellular IFN-γ production was analysed in CD8-positive cells by flow cytometry. Results were compared with those of a non-immunized mouse. Grey bars: non-immunized mice; black bars: immunized mice. C-: unrelated stimulus, NS3 BTV protein. The results represent the average of 6 mice ± SD. Asterisks represent significant difference between samples, calculated by Man-Whitney non parametric test (p≤0.01).

