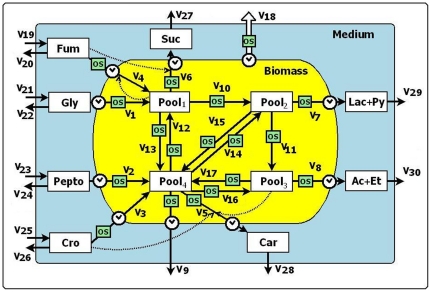
Figure 1. Schematic representation of the central metabolism of a L-carnitine overproducing E. coli strain applicable both to normal and osmotic stress conditions.
Solid lines represent rate processes and dotted arrows represent regulatory interactions. The empty arrow represents the output flux of biomass. The “clock” symbols represent a time-delay in a process whose value is a parameter estimated during the model calibration. The OS boxes represent the influence of the osmotic stress on the flux rate. See text for detail.

