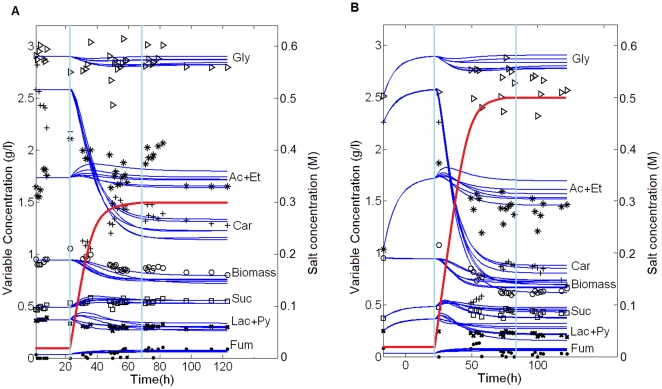
Figure 2. Model fitting and verification.
In all panels continuous lines represent the six best model solutions are represented (they are represented simultaneously in order to see the differences between them). The first vertical line indicates the moment (23 hours) when the medium switch begins by NaCl addition, while the second one indicates when the final steady state is reached (70 hours). Red lines represent the salt concentration in the extracellular medium. A. Model fitting in conditions of 0.3 M of final NaCl concentration. B. Model verification in conditions of 0.5 M of final NaCl.

