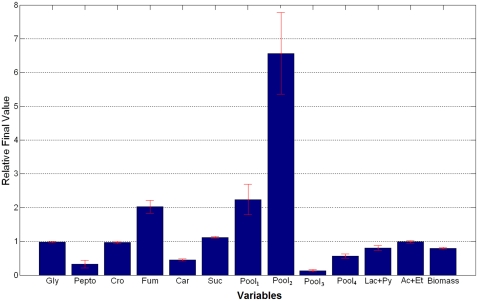
Figure 3. Relative variable concentration changes.
Mean values of the variables concentration changes for the selected solutions between the final, osmotic stress (0.3 M NaCl) and the initial steady state. Values were calculated as the ratio between the final and the initial steady states. All values are normalized with respect to the initial steady state values.

