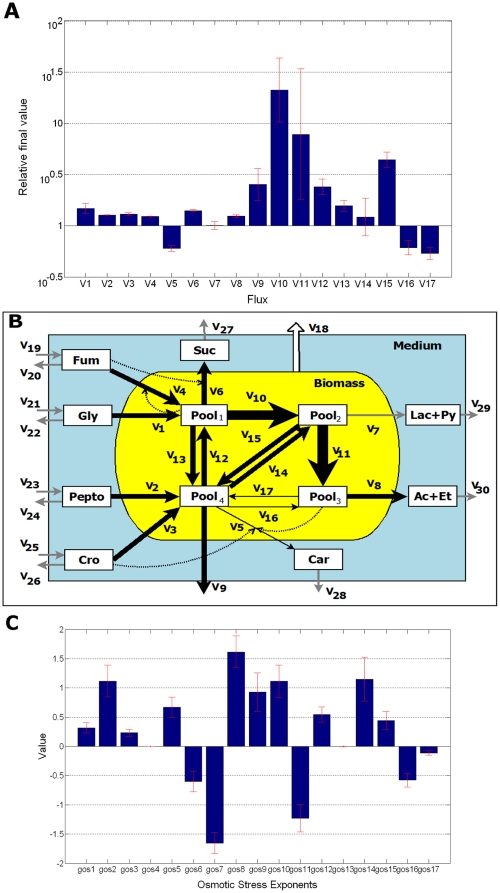
Figure 4. Flux changes and osmotic stress kinetic order distribution in osmotic conditions (0.3 M).
A. Mean flux changes in logarithmic scale of (the mean of) the selected solutions. Relative change was calculated as the ratio between the flux values (normalized by the biomass and the flux at the initial steady state) in the osmotic steady state and the corresponding normalized flux in the initial steady state. B. The magnitude of the flux changes are indicated by the thickness arrows. Thicker arrows represent fluxes which increase their value in stress condition; thinner ones are the fluxes that decrease their value after the salt switch, while the gray ones correspond to unchanged fluxes. All fluxes are normalized to the concentration of the biomass. C. gOS kinetic order value (mean values).

