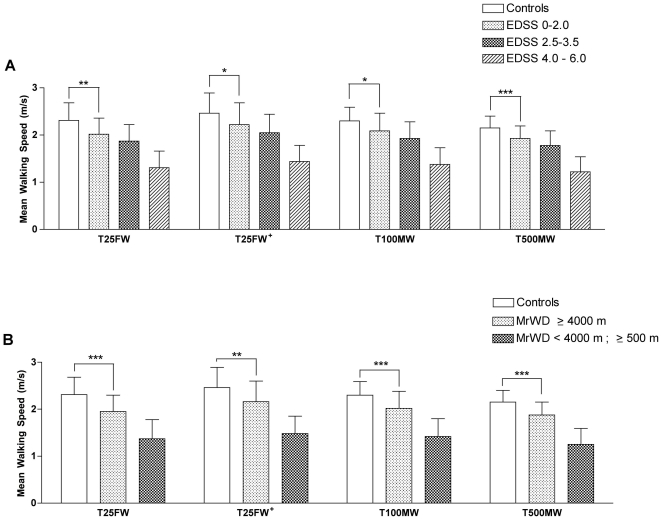
Figure 1. Mean walking speed (MWS) in healthy volunteers and in different subgroups of the pMS population.
The same general pattern of MWS differences across the different walking paradigms is observed in every group (T25FW+>T100MW>T25FW>T500MW). In the 4 walking tests, the MWS was significantly slower for each subset of the pMS population compared to healthy volunteers (all p<0,0001), including pMS with a low level of disability according to their EDSS status (EDSS≤2.0, A) or an apparently unlimited MrWD (MrWD≥4000 m, B).

