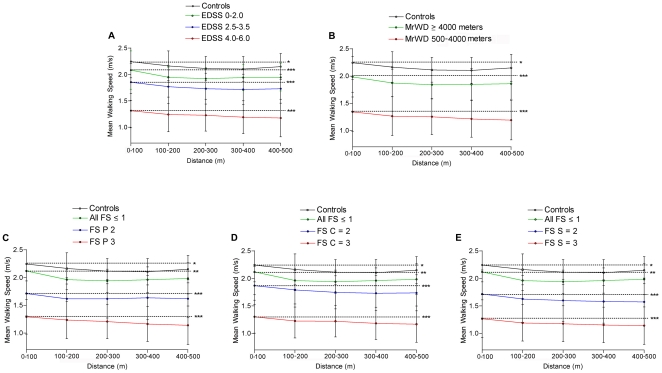
Figure 2. MWS over five successive 100 m interval laps along the T500MW.
Subgroup analysis are presented in healthy volunteers and in different subgroups of the pMS population, stratified according to their EDSS (A), their maximum reported walking distance (MrWD) (B), and their pyramidal (C), cerebellar (D) and sensitive (E) functional scores (FS). The dashed lines represent the comparison between the “baseline” MWS of the first 100 m (T0–100MW) and the “final” MWS of the last 100 m (T400–500MW) for all subgroups. t-test values were *p<0.05, **p<0.01, ***p<0.0001.

