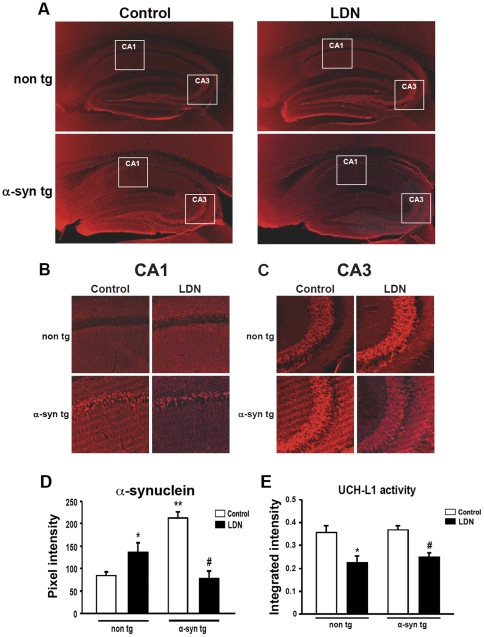
Figure 4. Immunohistochemical analysis of a-syn expression in the hippocampus of control and LDN-treated non tg and a-syn tg mice.
Representative hippocampal vibratome sections from control and LDN-treated non tg and a-syn tg mice that were immunolabeled with the anti-a-syn antibody, that recognizes both human and mouse forms of this protein (A). Magnified insets corresponding to boxed areas in the CA1 (B) and CA3 (C) regions from (A) are shown. Mean fluorescence intensity in hippocampal sections from LDN-treated non tg and a-syn tg mice (D). * Indicates a significant difference between non tg mice that were treated with or without LDN P<0.05. ** Indicates significant difference between untreated non tg and a-syn tg mice P<0.05. # Indicates significant difference between a-syn tg mice that were treated with or without LDN P<0.05. Mean values ± SEM are shown. N = 6 mice per group, 3 sections per mouse. UCH-L1 activity in hippocampal homogenates from non tg and a-syn tg mice treated with or without LDN (E). * Indicates a significant difference between non tg mice that were treated with or without LDN P<0.05. # Indicates a significant difference between a-syn tg mice that were treated with or without LDN P<0.01. N = 6 mice per group. Mean values ± SEM are shown. AU = arbitrary unit.

