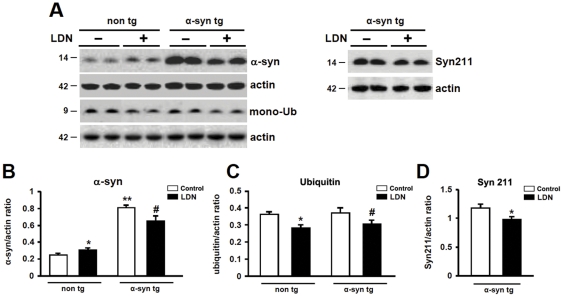
Figure 7. Comparison of a-syn and mono-ubiquitin protein expression levels in hippocampal lysates of control and LDN-treated non tg and a-syn tg mice.
Hippocampal lysates from control and LDN-treated mice were analyzed by Western blot (A). Analysis of a-synuclein (murine (B) and human (D)) and ubiquitin (C) levels in control or LDN-treated non tg and a-syn tg mice. * Indicates a significant difference between non tg mice that were treated with or without LDN, P<0.05 and P<0.01for a-syn and ubiquitin expression levels, correspondingly. ** Indicates a significant difference between untreated non tg and a-syn tg mice, P<0.001. # Indicates a significant difference between a-syn tg mice that were treated with or without LDN, P<0.05. (d) Analysis of human a-synuclein levels in control and LDN-treated a-syn tg mice. * Indicates a significant difference between control and LDN-treated a-syn tg hippocampal homogenates, P<0.01. N = 6 mice per group. Mean values ± SEM are shown.

